Performance
Ormdantic's performance strategy is to keep Python ergonomic and move repeated runtime work into Rust.
Use this page when you want to run benchmarks or understand where Ormdantic spends runtime work. It is not a promise that every query is faster than every alternative. Query shape, indexes, network latency, and database behavior still matter.
What is measured
The benchmark suite covers:
- Python-facing serialization and hydration
- table-handle CRUD
- query-expression paths
- joined and select-in relationship loading
- nested loader graphs
- reflection and migration flows
- Rust SQL and DML compilation
- dialect rendering
- schema diffing
- hydration planning
- select-in merging
- native driver execution
ORM comparison report
The repository also includes a reproducible comparison report under
benchmark/. It compares Ormdantic, SQLAlchemy, and SQLModel across SQLite,
PostgreSQL, and MySQL. SQLite runs use temporary local files; PostgreSQL and
MySQL runs use the Docker Compose services under docker/databases/.
The charts show every measured case so improvements and regressions stay visible
instead of being hidden behind a single aggregate number.
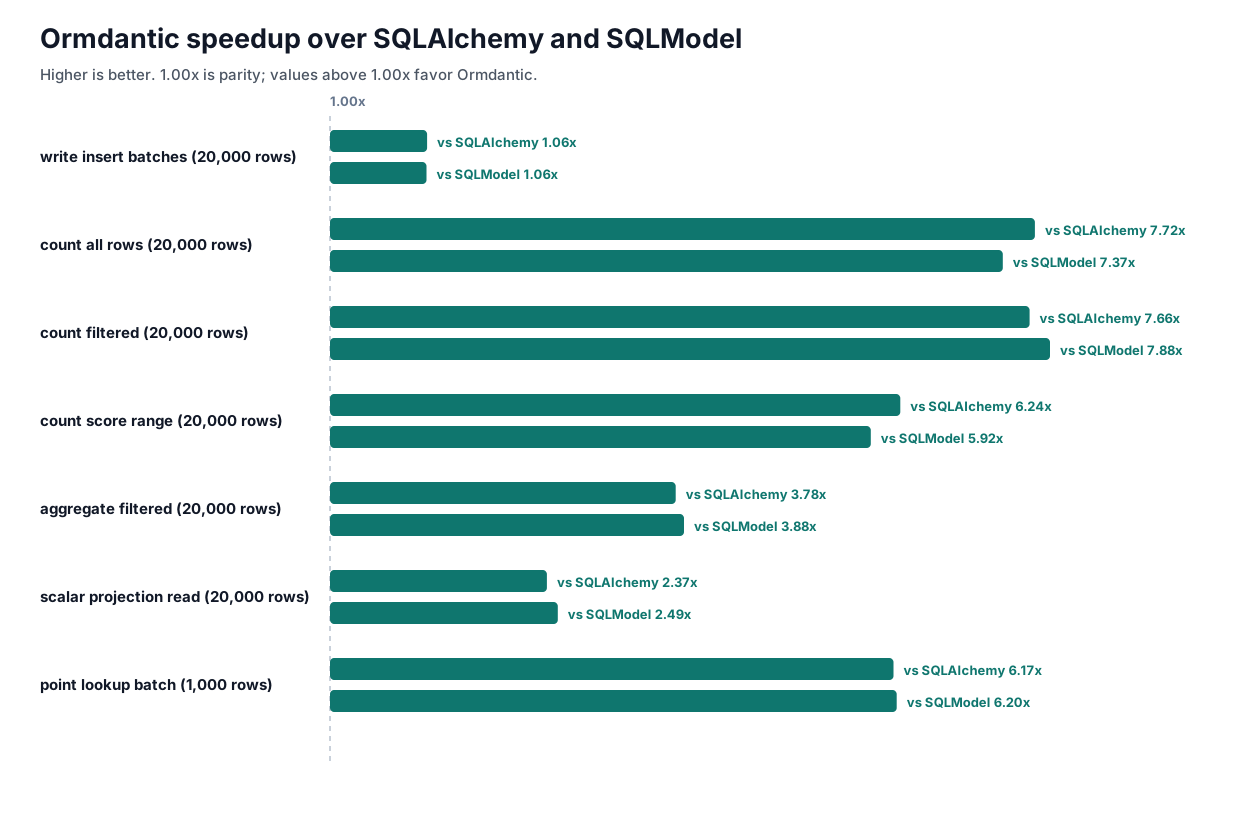
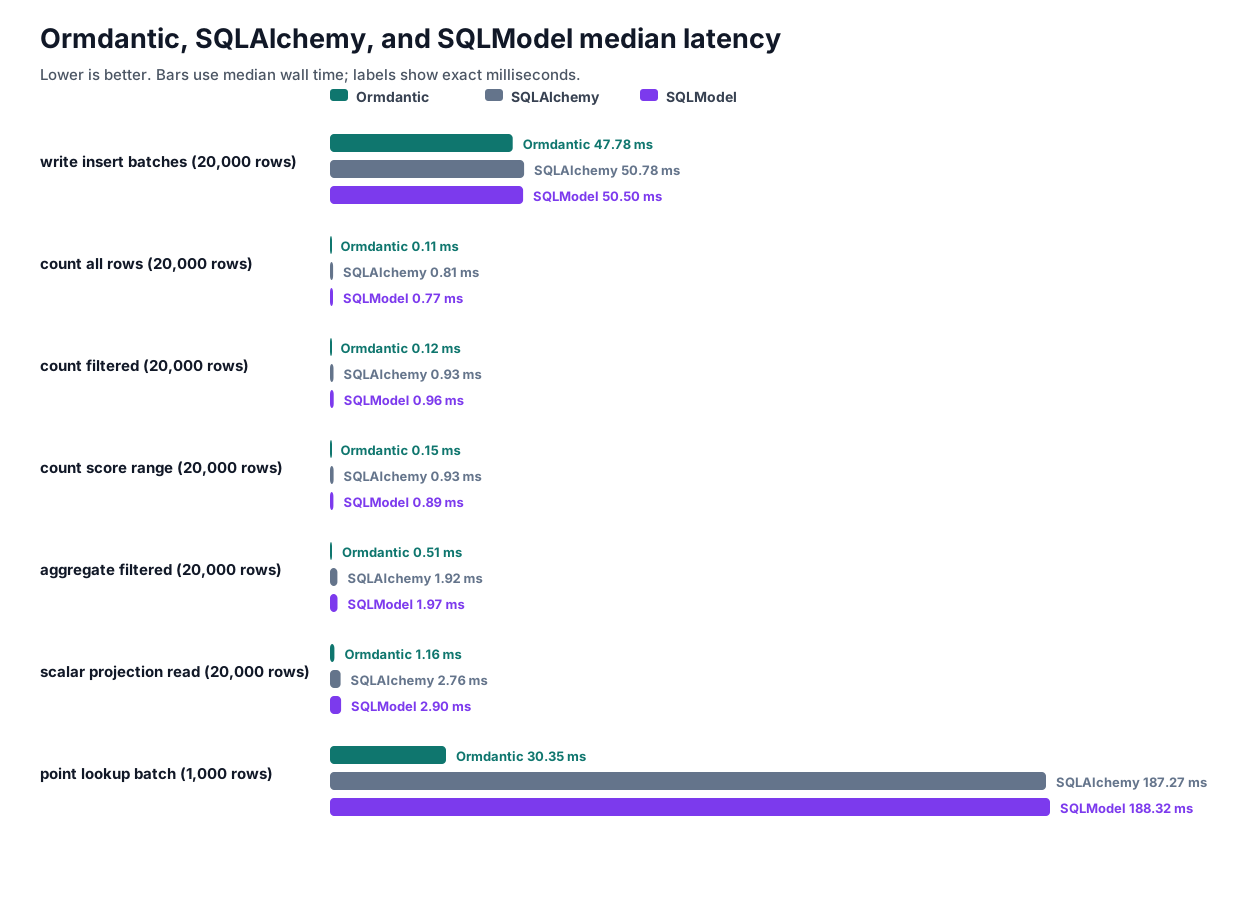
Regenerate the report and SVGs:
uv run --group dev maturin develop --release
uv run --group benchmark python -m benchmark.run --backend sqlite --profile default
Run the pull-request profile or a targeted case:
make benchmark-ci
make benchmark-target CASE="orm insert models"
The CI profile uses 10,000 read and write rows, two warmups, seven measured rounds, and 500-row write batches. ORM order rotates between rounds. Results retain raw samples, median absolute deviation, order position, and deterministic bootstrap confidence intervals for comparisons.
Use the release native extension for report artifacts. Debug Rust builds are for development feedback and can make native write paths look artificially slow.
Run server-backed smoke profiles:
docker compose -p ormdantic-benchmark -f docker/databases/docker-compose.yaml up -d --wait postgres mysql
uv run --group benchmark python -m benchmark.run --backend postgres --profile smoke
uv run --group benchmark python -m benchmark.run --backend mysql --profile smoke
Run the materialized million-row profile:
uv run --group dev maturin develop --release
uv run --group benchmark python -m benchmark.run --backend sqlite --profile million
The billion profile requires --i-understand-this-may-be-expensive. Use
--planner-scale for planner-scale artifacts. Those artifacts can discuss query
shape and database estimates, but they must not be merged into materialized
latency charts.
The command writes JSON, CSV, and SVG outputs under benchmark/, plus docs-ready
SVG copies under docs/assets/benchmarks/.
Pull requests run base and head on the same unprivileged runner. A separate trusted workflow validates the artifact identity and ZIP structure, regenerates the Markdown, CSV, JSON, and SVG from default-branch code, and publishes the image at an immutable head-SHA path. Serialization cases with different semantics are labeled diagnostic and do not affect aggregate speedups or the regression gate.
Run Python benchmarks
Run the CodSpeed-enabled Python benchmarks locally:
uv run pytest tests/benchmarks --codspeed
The same benchmark tests also work with the local pytest-benchmark plugin:
uv run pytest tests/benchmarks
Run Rust benchmarks
Install the CodSpeed cargo subcommand once:
cargo install cargo-codspeed --locked
Run Rust benchmarks:
cargo codspeed build
cargo codspeed run
Without CodSpeed, use Criterion compatibility locally:
cargo bench --workspace
Read benchmark results
Look for regressions in:
- query compilation
- relationship loading
- hydration
- driver execution
- migration reflection
Small benchmark wins are less important than keeping the Python API predictable and the Rust boundary stable.